It’s that time again, you just received your DRMG Insight monthly report, but what do all these stats and figures mean, really? At the core of it, DRMG Insights represents real accountability for your marketing dollars. We’ll break down all the details of your report to help you understand the results your campaigns are driving.
Your Highlights
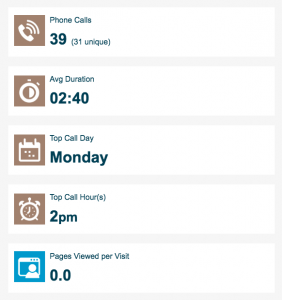 Each month, we collect important key performance metrics for your Direct Mail and Digital campaigns. These metrics include, how many phone calls you received, the average duration and even what day and hour were your top performers. This information is vital to understanding your ROI and allows your company to determine if adjustments are needed to accommodate your busiest call days.
By logging into your DRMG Insight profile, you can take a deeper dive into each phone call and new prospect. The DRMG Insights Prospects Page allows you to look at your prospects by source or campaign, and gain insights by reviewing all collected data – including listening to calls for call tracking campaigns.
Newest Prospects
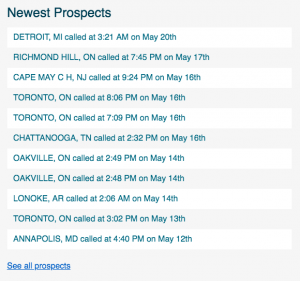 Just below your highlights, you’ll find a list of your latest prospects. This section allows you to see at a glance where your leads are coming from and the volume that is being captured. But don’t worry! This is only a snapshot of your most recent prospects, by clicking “See All Prospects”, you’ll be able to review each one from the last 30 days and listen to each individual call.
Analyzing Your Phone Leads
By recording and listening to calls, you can identify areas of improvement that can convert the lead more successfully. You can take note on how engaged the person answering the call is, and whether they nurture the lead. The number of calls you receive monthly from each campaign will ultimately illustrate how successful your advertisement was. Once you understand the volume, you can categorize your leads by rating them with a, b, or c to reflect their qualification. This will enable you to compare next months report to this months.
Prospects are captured by Campaign and Lead Source, and manageable by the use of filters. Icons in the Filter Column can help you review and segment your leads further.
When reviewing your prospects, you can use these handy icons to make notes and rate each call. Here’s your quick guide to understanding what each symbol means:
- Thumbs Up = Good Lead, Strong Prospect
- Thumbs Down = Bad Lead, not a true Prospect
- Dollar Sign = Successfully Sold, Converted Prospect
- Arrow = Follow Up Required
- Bubble = Add a note in the Insight System
Prospect data is comprehensive and includes: date, time, campaign, geographical city, telephone numbers, and email. You can use Prospects Page to manage and categorize your prospects, and from there, you can export all prospects listed in your sort range.
Understanding ROI
Return on Investment or ROI as we like to call it is typically your ‘cost per lead’. You should look at your investment in direct mail or digital marketing with DRMG, and divide that number by the total number of inquiries you received. From there, you can determine how many inquiries turned into customers, and how valuable each customer is. Each month you’ll have the opportunity to compare your ROI to the previous months and work together with the DRMG team to continue to increase your ROI.
Still need help decoding your report? Don’t fret, you can call us at 1 (833) 749-0405 to discuss your report in detail with our Insight experts.
Comments